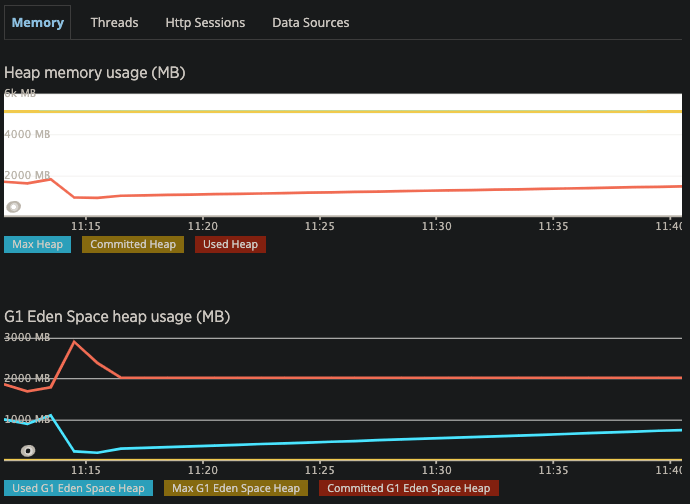
While setup New Relic Java agent in Jira, I found out that there is an extra option '-Datlassian.org.osgi.framework.bootdelegation.extra=com.newrelic.*' that you need to add into JVM parameters to make New Relic Java Agent to work with Jira. This is due to Jira uses OSGI framework, and the default boot class loader does not load the extra … Continue reading Use New Relic Java Agent with Jira
Category: Monitoring
Jira and Confluence Performance Monitoring Part One
I have been recently working on improving our performance monitoring against Jira and Confluence. And here I want to share a few things that I learned, and hope they are useful to you as well. In high level, we have done: Setup both black box monitoring (CPU, memory, IO, Error log ...) and white box … Continue reading Jira and Confluence Performance Monitoring Part One
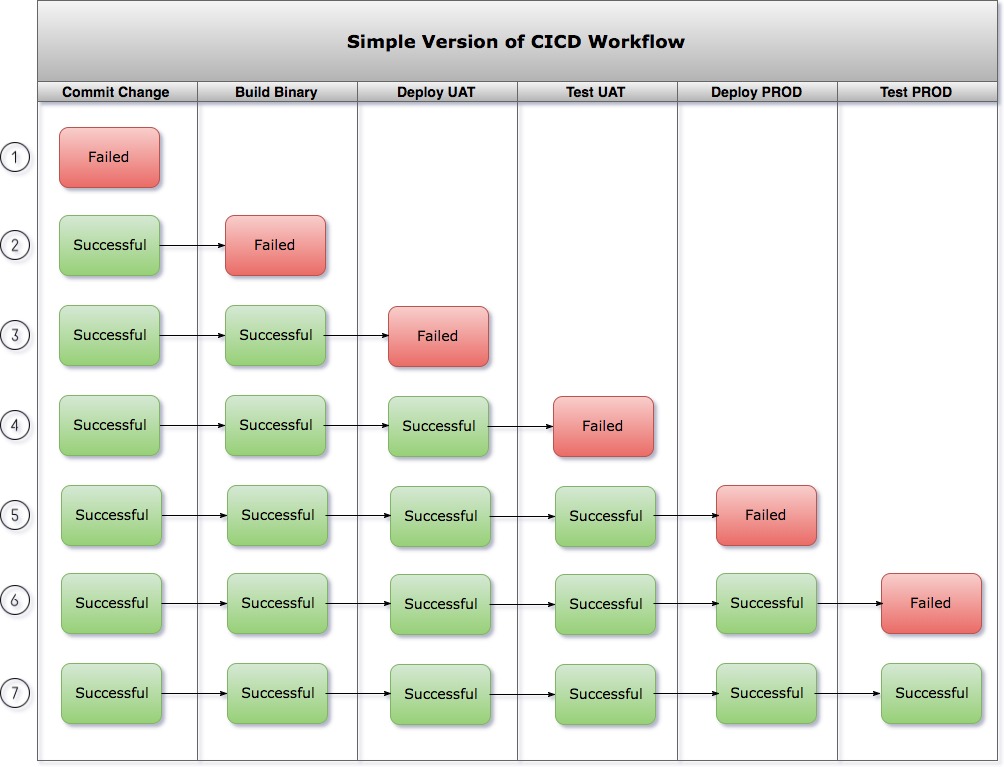
Simple version of CICD Workflow
Above is my simple version of CICD workflow that I use as a guidance in day to day work. A bit explanations on how to use it. The workflow has six stages and seven scenarios. Six Stages: Commit Change: When user commit changes to code repository. Build Binary: When CI server builds the binary to … Continue reading Simple version of CICD Workflow
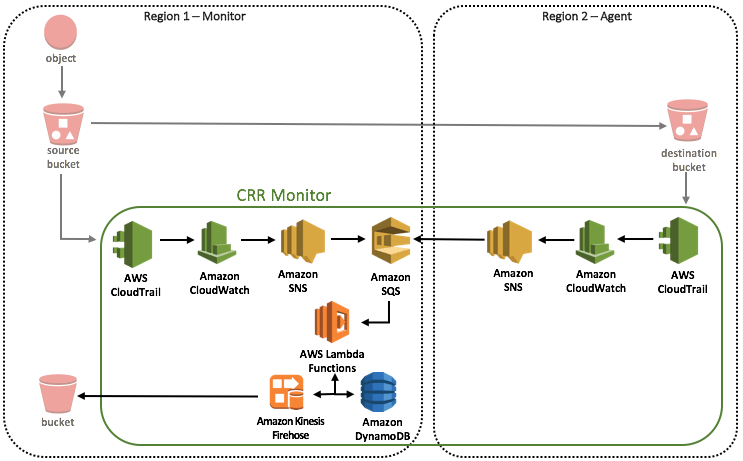
Cross-Region S3 Replication Monitor
Reference: https://aws.amazon.com/answers/infrastructure-management/crr-monitor/
OpenShift V3 Persistent Storage Nagios Plugin
By the time of writing, OpenShift V3 comes with poor monitoring capabilities. The build-in monitoring only checks the metrics of Memory/CPU/Network, and it does not even support alerting! And the lowest granular level only down to last hour. So you have to build your own monitoring if you want to keep close eyes on your … Continue reading OpenShift V3 Persistent Storage Nagios Plugin


